Staff Finds: Growth and Development Charts
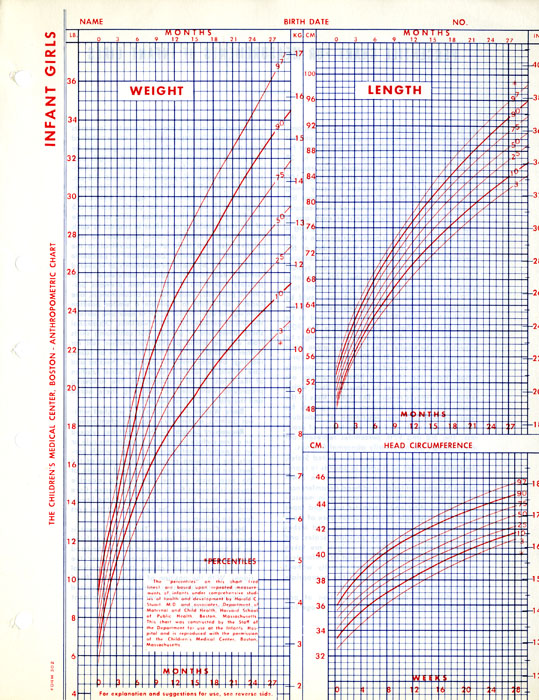
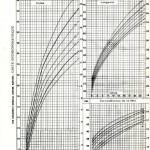
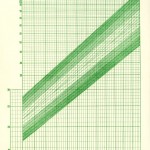
Infant girls anthropometric growth chart, created with data from the Harvard School of Public Health Longitudinal Studies of Child Health and Development. From the Harvard Medical Library in the Francis A. Countway Library of Medicine.
Processing staff in the Center for the History of Medicine recently found a variety of child growth and development charts while processing the records of the Harvard School of Public Health Longitudinal Studies of Child Health and Development (also known as the Growth Study). Many were created using data from the Harvard Growth Study, but the collection also contains charts that were likely developed by other organizations, collected as reference in the course of research.
The Growth Study was founded in 1930 by Harold Coe Stuart in the Harvard School of Public Health Department of Maternal and Child Health, and included an initial study (birth through maturity) and multiple follow-up studies through the late 1980s. Over 300 subjects were enrolled between 1930 and 1939, and of those 134 were followed through to maturity (18 years). The study monitored a number of aspects of health and development; however, a major focus of the original study was the tracking of physical growth and development through anthropometric measurements, x-rays, and progressive somatotype photographs. This data was then used to make standardized growth charts for distribution to physicians and researchers. Subjects were primarily of North European ancestry and from the Boston area; while this allowed for a controlled study, it may have also limited the charts’ applicability to a wider population.
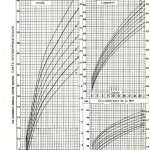
Stuart’s original male and female curves were distributed by Mead Johnson International, and charted weight, length, and head circumference for infants, and height and weight for children through age 12. These charts were later translated into French for distribution in Canada, and potentially into other languages. A letter by William M. Schmidt references a later percentile chart that was developed in the 1960s, covering birth through 18 years, although examples have not yet been found in the collection. According to an article by de Onis and Yip, Stuart’s charts later became an international standard of reference when in 1966, the World Health Organization widely distributed a version with combined male and female data.
An earlier chart can be found in the collection that was developed in collaboration with the University of Iowa, in which Harvard data is displayed for years 0 through 5, and Iowa data is displayed for years 5 through 18. The collection also contains: charts developed by the University of Iowa (covering years 4 through 18); Danish height and weight charts created through an unidentified study; and physical and social development charts (covering birth to 56 weeks), published by Ross Developmental Aids using data from an unidentified study.
Examples of the mentioned charts and related correspondence may be found below.
The records of the Harvard School of Public Health Longitudinal Studies of Child Health and Development are expected to be open to research in summer 2016. Processing of the collection is part of the Bridging the Research Data Divide project, funded by a Hidden Collections grant administered by the Council on Library and Information Resources (CLIR). For more information on the project, please contact the project’s principal investigator, Emily R. Novak Gustainis, Deputy Director of the Center for the History of Medicine.
-

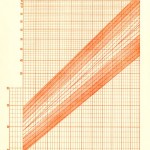
- Infant boys anthropometric growth chart, created with data from the Harvard School of Public Health Longitudinal Studies of Child Health and Development. From the Harvard Medical Library in the Francis A. Countway Library of Medicine.
-
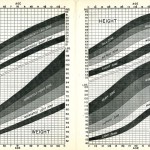
- Boys anthropometric growth chart, created with data from the Harvard School of Public Health Longitudinal Studies of Child Health and Development. From the Harvard Medical Library in the Francis A. Countway Library of Medicine.
-
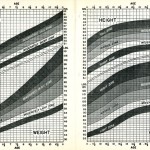
- Girls anthropometric growth chart, created with data from the Harvard School of Public Health Longitudinal Studies of Child Health and Development. From the Harvard Medical Library in the Francis A. Countway Library of Medicine.
-

- Correspondence from William M. Schmidt to Dr. Laszlo Molnar, 04 October 1962, regarding growth charts from the Harvard School of Public Health Longitudinal Studies of Child Health and Development. From the Harvard Medical Library in the Francis A. Countway Library of Medicine.
-

- Correspondence from Harold C. Stuart to P. Conway Jones, probably May 1962, regarding translation of growth charts from the Harvard School of Public Health Longitudinal Studies of Child Health and Development. From the Harvard Medical Library in the Francis A. Countway Library of Medicine.
-
- French translation of girls anthropometric growth chart, created with data from the Harvard School of Public Health Longitudinal Studies of Child Health and Development. From the Harvard Medical Library in the Francis A. Countway Library of Medicine.
-

- French translation of boys anthropometric growth chart, created with data from the Harvard School of Public Health Longitudinal Studies of Child Health and Development. From the Harvard Medical Library in the Francis A. Countway Library of Medicine.
-
- French translation of infant boys anthropometric growth chart, created with data from the Harvard School of Public Health Longitudinal Studies of Child Health and Development. From the Harvard Medical Library in the Francis A. Countway Library of Medicine.
-
- French translation of infant girls anthropometric growth chart, created with data from the Harvard School of Public Health Longitudinal Studies of Child Health and Development. From the Harvard Medical Library in the Francis A. Countway Library of Medicine.
-

- Weight and height growth charts created with data from the Harvard School of Public Health Longitudinal Studies of Child Health and Development and the University of Iowa Child Welfare Station Study. From the Harvard Medical Library in the Francis A. Countway Library of Medicine.
-
- Boys height and weight growth charts created with data from the University of Iowa Child Welfare Station Study. From the Harvard Medical Library in the Francis A. Countway Library of Medicine.
-
- Girls height and weight growth charts created with data from the University of Iowa Child Welfare Station Study. From the Harvard Medical Library in the Francis A. Countway Library of Medicine.
-
- Danish boys height and weight chart, created with data from an unknown study. From the Harvard Medical Library in the Francis A. Countway Library of Medicine.
-
- Danish girls height and weight chart, created with data from an unknown study. From the Harvard Medical Library in the Francis A. Countway Library of Medicine.
-

- Girls Physical Development Chart (Birth to 56 Weeks), published by Ross Developmental Aids with data from an unidentified study. From the Harvard Medical Library in the Francis A. Countway Library of Medicine.
-

- Girls Adaptive-Social Development Chart (Birth to 56 Weeks), published by Ross Developmental Aids with data from an unidentified study. From the Harvard Medical Library in the Francis A. Countway Library of Medicine.
-

- Boys Physical Development Chart (Birth to 56 Weeks), published by Ross Developmental Aids with data from an unidentified study. From the Harvard Medical Library in the Francis A. Countway Library of Medicine.
-

- Boys Adaptive-Social Development Chart (Birth to 56 Weeks), published by Ross Developmental Aids with data from an unidentified study. From the Harvard Medical Library in the Francis A. Countway Library of Medicine.
![]() Center News, Initiatives, New Acquisitions, Public Health
|
Center News, Initiatives, New Acquisitions, Public Health
| ![]() Harvard T.H. Chan School of Public Health Longitudinal Studies of Child Health and Development
Harvard T.H. Chan School of Public Health Longitudinal Studies of Child Health and Development